
Most clubs track everything and understand nothing. Login counts, page views, email opens—these vanity metrics fill dashboards but miss the operational signals that actually matter. After building tracking systems for dozens of membership organizations, from professional associations to hobby clubs, the pattern is clear: clubs drowning in data while missing the four or five numbers that predict whether members stick around.
The real problem isn't lack of data. It's that most member engagement KPIs for clubs track symptoms instead of causes. A member who logs in weekly but never attends events is heading for the exit. Someone who RSVPs constantly but never shows up signals a different problem. The club tracking "total logins" misses both patterns entirely.
The engagement metrics trap eating club resources
A board member asks about engagement. Staff pulls login reports, event attendance sheets, volunteer hour logs. Someone builds a spreadsheet. Numbers get discussed at the monthly meeting. Nothing changes because nobody knows what the numbers mean or what to do about them.
Meanwhile, operational reality tells a different story. The photography club celebrating 85% event attendance doesn't notice that the same 12 people show up every time while 200+ members stay dormant. The professional association proud of their 70% email open rate misses that renewal rates dropped 15% because members open emails but find nothing relevant.
The worst part? Clubs spend hours collecting this data manually. Volunteer coordinators count heads at events. Membership directors export login reports. Committee chairs track participation in spreadsheets. All this effort produces numbers that look good in reports but provide zero operational guidance.
Finding signal in the noise: which KPIs predict outcomes
First meaningful interaction timing matters more than total interactions. A new member who doesn't engage within 14 days has a 65% chance of going dormant. But "engage" doesn't mean login—it means taking an action that connects them to the community. Posting in a forum, RSVPing to an event, joining a committee, completing their profile beyond the required fields.
Keep your membership organized and engaged.
Clubyly simplifies member management, event coordination, and payment collection—effortlessly.
- Unified member database
- Automated payment tracking
- Event scheduling & reminders
No credit card required
Track days from join to first voluntary action. Set your threshold at 14 days. When someone crosses it, trigger outreach. Not a generic "we miss you" email, but specific invitations based on their member type or stated interests.
Engagement variety beats engagement volume. The member who attends every workshop but never volunteers is less stable than someone who mixes activities. Track unique engagement types per quarter: events attended, volunteer hours, forum posts, resource downloads, profile updates. Members touching three or more categories renew at 85%+. Those stuck in one category, regardless of frequency, churn at 40%.
Recovery velocity after dormancy predicts long-term health. Everyone goes quiet sometimes—work gets busy, life happens. What matters is how quickly they return and at what level. Track the gap between engagement periods and the activity level when they return. Members who go dark for 60+ days rarely return to previous engagement levels. But those re-engaged within 30 days typically increase participation.
Data sources hiding in plain sight
Clubs often claim they can't track these metrics, but the data already exists scattered across systems. The problem is integration, not availability.
Event platforms track RSVPs and attendance. Email systems show opens and clicks. Payment processors record transaction history. Member portals log access patterns. Forum software tracks posts and comments. The challenge: pulling this into a unified view without spending weeks in spreadsheets.
Start with what you already have. Export event attendance monthly. Pull email engagement quarterly. Download portal access logs. You don't need real-time data to spot patterns—monthly snapshots reveal trends just fine.
Use member ID as the integration key when exporting each dataset to combine them quickly in a single sheet.
The integration shortcut most clubs miss: use member ID as your connection point. Every system has some form of member identifier. Export each dataset with this ID, combine in a simple spreadsheet, and suddenly scattered data becomes unified intelligence.
Threshold rules that trigger action (not reports)
Metrics without thresholds are just numbers. Thresholds without actions are just alerts. The complete system needs all three: metric, threshold, response.
| Metric | Threshold | Triggered Action |
|---|---|---|
| Days since last engagement | 30 days | Personal outreach from committee member |
| Event no-show rate | 2 consecutive | Phone call to understand barriers |
| Engagement variety score | <2 categories for 60 days | Invitation to different activity type |
| Forum posts per month | 0 for new members | Direct message with conversation starter |
| Volunteer hours | 0 in 6 months | Survey about availability and interests |
These aren't suggestions—they're operational rules. When the threshold trips, the action happens. No committee discussion, no waiting for the monthly meeting. The trigger creates the task.
Small clubs sometimes worry about overwhelming volunteers with outreach tasks. But targeted thresholds generate manageable volume. A 200-member club might trigger 15-20 actions monthly. Spread across a 5-person engagement committee, that's one phone call or personal email per week per volunteer.
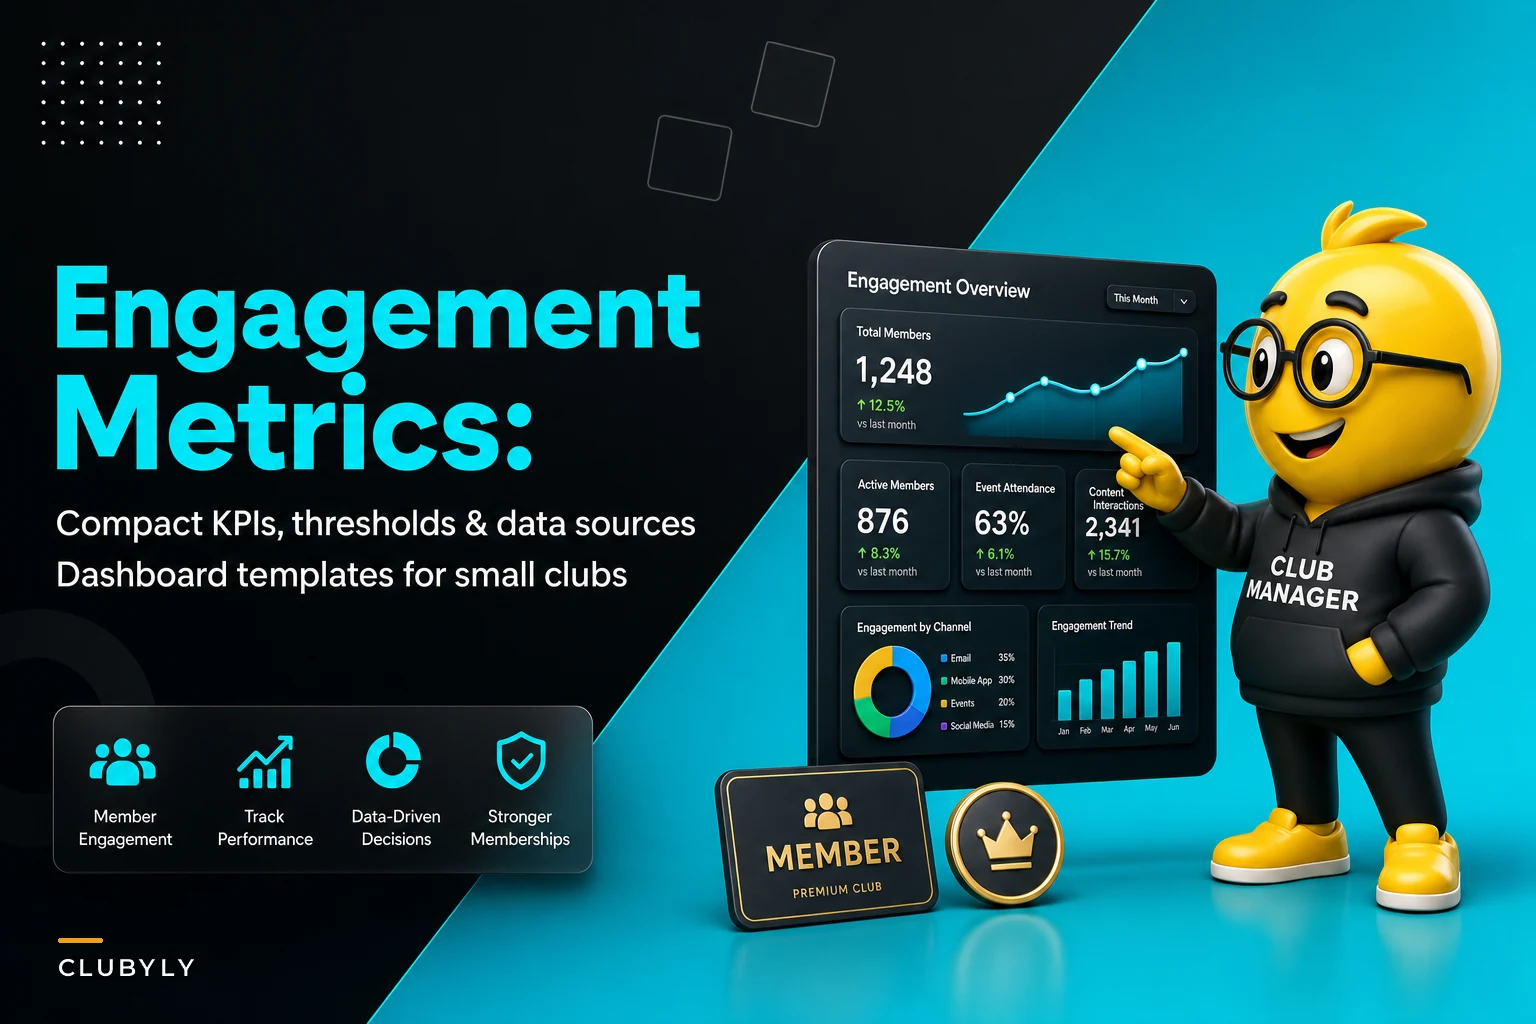
Dashboard design for 10-second decisions
Most club dashboards fail because they try to show everything. Board members see walls of numbers and charts but can't answer the basic question: what needs attention right now?
Effective dashboards follow the stoplight principle. Green means healthy, yellow needs watching, red demands action. No interpretation required.
Primary dashboard view:
-
Active member percentage (engaged in last 30 days)
-
At-risk count (crossed dormancy threshold)
-
Recovery success rate (re-engaged members staying active)
-
Variety score distribution (single vs. multi-category members)
Drill-down view:
-
Individual member status list with days since last activity
-
Threshold violations requiring action
-
Completed vs. pending outreach tasks
-
Trend lines for each primary metric
Monthly snapshot:
-
New member activation rate
-
Churn prediction based on current patterns
-
Volunteer capacity vs. outreach needs
-
Comparison to previous quarter
Keep visuals minimal. Bar charts for distributions, line graphs for trends, simple tables for action items. If someone needs training to read your dashboard, it's too complex.
Getting started without perfect data
Waiting for the perfect tracking system means never starting. Begin with manual tracking of one or two metrics. Pick the ones causing immediate pain.
If retention is dropping, start tracking days since last engagement. Export your member list, add a column for "last activity date," update it weekly. After a month, you'll see patterns.
If events feel empty despite high membership, track unique attendees vs. repeat attendees. Simple sign-in sheets with member IDs work fine. Count how many different people attend across three months vs. how many times the regulars show up.
Concerned about volunteer burnout? Track variety, not just hours. Who's doing multiple jobs vs. who does one thing repeatedly? A simple spreadsheet with member names and activity types reveals concentration risk.
Moving from tracking to prevention
The cycling club thought they had an engagement problem. Their dashboard showed 40% of members hadn't logged into the portal in 60 days. The board spent months debating portal improvements, better content, user experience fixes.
Then they started tracking engagement variety instead of portal logins. The real issue emerged: members were engaged, just not online. They attended rides, volunteered at events, participated in maintenance workshops. But the club measured digital engagement while operating primarily in-person.
The fix wasn't portal improvements—it was recognizing that different member segments engage differently. They segmented their tracking: digital-first members, event-focused members, volunteer-heavy members. Each segment got different thresholds and interventions.
This shift in tracking prevented a costly portal rebuild that would've solved nothing. More importantly, it revealed that their "unengaged" members were actually their most active volunteers.
Automation that enhances, not replaces
When threshold monitoring triggers 20+ monthly actions, manual tracking breaks down. This is where AI-powered operational software makes the difference between good intentions and consistent execution.
Modern platforms can pull data from multiple sources—payment systems, event platforms, email tools—and automatically calculate engagement metrics. When thresholds trip, they create tasks for staff or volunteers. Not generic alerts, but specific actions with context: "Sarah Johnson hasn't engaged in 35 days. Last activity: RSVP'd to workshop but didn't attend. Suggested outreach: call to discuss scheduling challenges."
The automation handles the tedious parts—data collection, threshold monitoring, task creation—while humans handle the meaningful parts: personal outreach, relationship building, problem-solving.
Some clubs worry automation makes things impersonal. It's actually the opposite. When you stop spending hours on spreadsheets, you have time for real conversations. When the system alerts you that a longtime member's engagement pattern changed, you can reach out before they drift away completely.
Common mistakes in KPI selection
Choosing metrics that sound good over ones that drive decisions. "Member satisfaction score" sounds important but what do you do when it drops? "Days since last voluntary action" tells you exactly who needs attention.
Tracking leading indicators without lagging validation. Event RSVPs (leading) mean nothing without attendance tracking (lagging). Email opens (leading) need renewal rate correlation (lagging) to matter.
Setting universal thresholds for diverse populations. The professional association member who engages quarterly might be perfectly healthy. The hobby club member with the same pattern is probably gone. Segment your thresholds by member type, tenure, or engagement preference.
Creating dashboards for boards instead of operators. Board members need trends and health scores. Staff and volunteers need names and actions. Build two views, not one compromise that serves neither.
Building your compact KPI system
Start with this foundation, then customize based on your club's operational reality:
Core metrics (track for everyone):
-
Days since last voluntary engagement
-
Engagement variety score (unique activity types)
-
Response rate to direct outreach
-
Time from join to first meaningful action
Segment-specific additions:
-
Professional associations
credential maintenance, education participation
-
Hobby clubs
project participation, skill-sharing activity
-
Service organizations
volunteer hours, beneficiary interaction
-
Social clubs
guest introductions, event hosting
Warning thresholds (adjust based on your patterns):
-
New member
no engagement in 14 days
-
Active member
no engagement in 30 days
-
Long-term member
no engagement in 60 days
-
Volunteer
single activity type for 90 days
Response protocols:
-
Threshold trip → task creation (within 24 hours)
-
Task assignment → completion (within 72 hours)
-
Completion → outcome tracking (immediate)
-
Pattern recognition → threshold adjustment (monthly)
The system works when it's simple enough to maintain but comprehensive enough to catch problems early. Most clubs need 4-6 metrics, not 40.
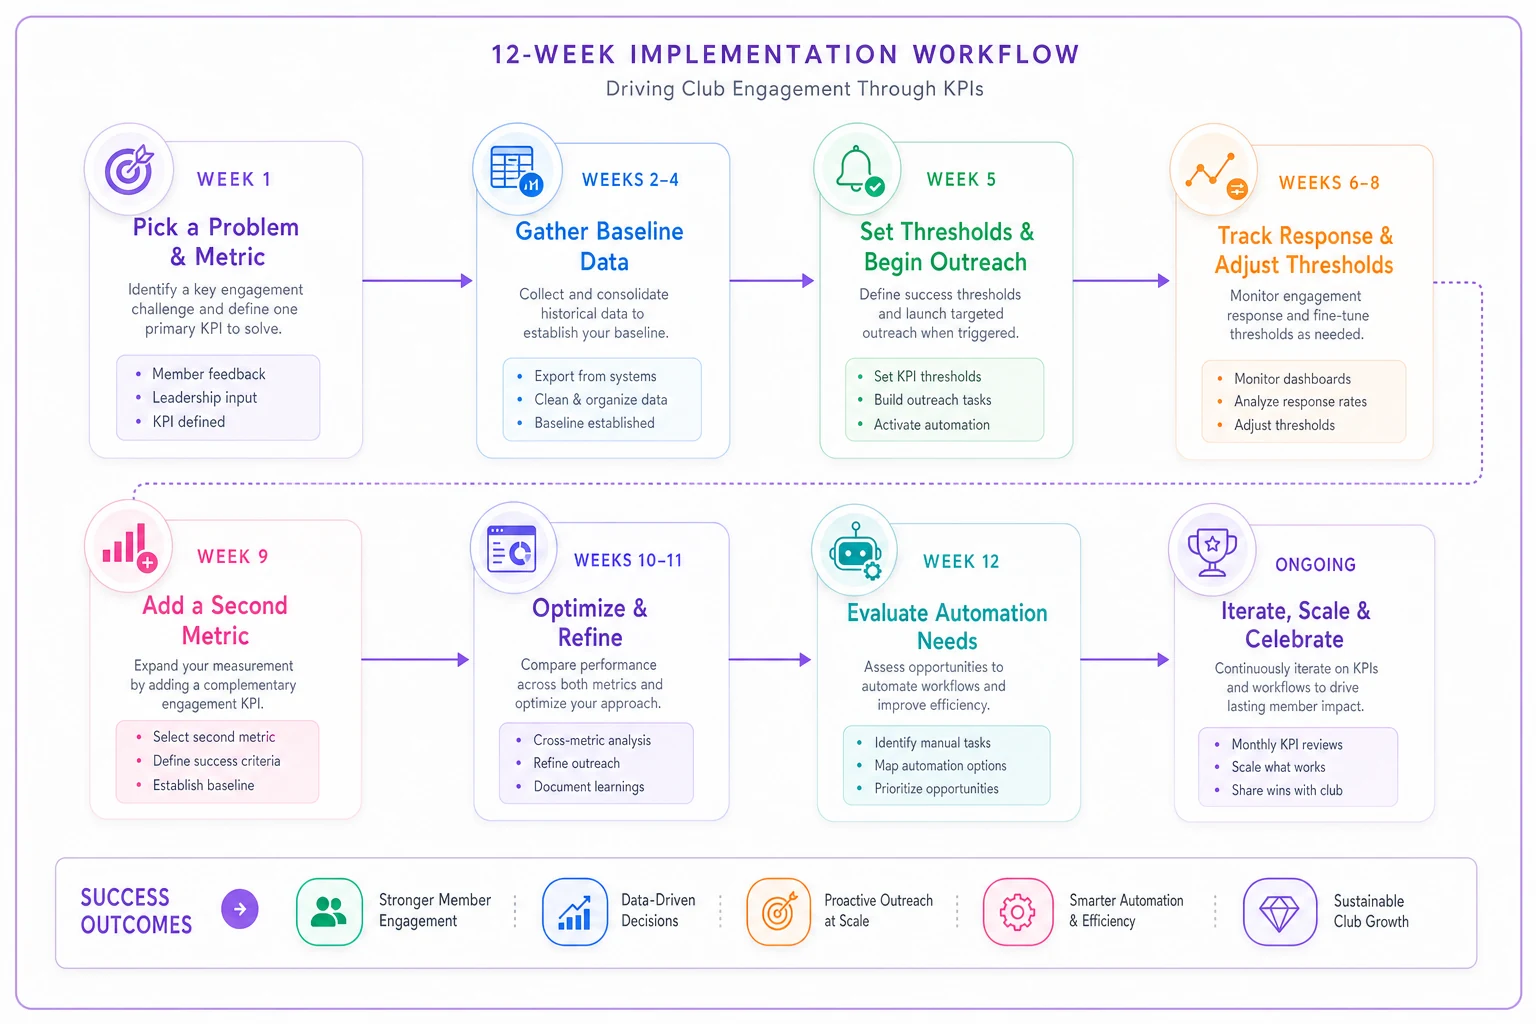
The path forward: implementation sequence
Week 1: Pick one painful problem. Choose the corresponding metric. Start manual tracking.
Week 2-4: Gather baseline data. No actions yet, just observation.
Week 5: Set initial thresholds based on patterns. Begin triggered outreach.
Week 6-8: Track response rates. Adjust thresholds if triggering too many or too few actions.
Week 9: Add second metric. Repeat the process.
Week 12: Evaluate automation needs. If manual tracking takes more than 2 hours weekly, consider operational software.
Visual workflow for the 12-week sequence:
The clubs that succeed with member engagement KPIs share one trait: they track fewer metrics but act on all of them. Quality beats quantity when every metric has a threshold and every threshold has a response.
Stop collecting data that doesn't drive decisions. Stop building dashboards that don't prompt action. Focus on the compact set of metrics that predict member behavior, set clear thresholds that trigger intervention, and build simple dashboards that anyone can read in 10 seconds.
The health of your club hides in the patterns between the obvious metrics—in the variety of engagement, the speed of recovery, the timing of first actions. Track those patterns, act on the thresholds, and watch retention improve without massive engagement campaigns or costly portal rebuilds.
Most importantly, remember that metrics serve operations, not the other way around. If a metric doesn't help you decide what to do Monday morning, drop it. Your time is better spent talking to members than perfecting spreadsheets.
Ready to streamline your club operations?
Join 500+ clubs using Clubyly to save time, boost member engagement, and grow their communities.