


Most cohort retention advice assumes you have a data warehouse and a few thousand signups per month. That's useless if your entire club joins in waves of 15 to 40 people, and half your "data" lives in a Google Sheet somebody named membersFINALv3. The math that works for a SaaS company with 8,000 monthly signups falls apart when noise swamps signal — you end up making decisions off a cohort where one person leaving swings your retention rate by five points.
The problem isn't that small clubs can't do cohort analysis. It's that they either skip it entirely — too intimidating — or they do it wrong, treating a 19-person cohort like it's statistically meaningful and panicking over normal variance. This post is about the middle path: recipes that respect how small your numbers actually are.
Why tiny cohorts lie to you
When your cohort is 20 people, each individual is worth 5 percentage points. If two members churn in a quarter that "should" have kept everyone, your retention drops from 100% to 90% and it feels like a trend. It isn't. It's two people who moved cities, got a new job, or just forgot to renew.
This usually plays out as a board meeting where someone pulls up a chart of "declining Q3 retention" and everyone starts brainstorming emergency interventions — when the honest answer is the cohort was too small to tell you anything useful.
A better mental model: below about 30 members per cohort, you're not measuring a rate, you're counting individuals. So count individuals. Instead of saying "our retention fell to 82%," say "we lost 4 of 22 people, and here's why each one left." That reframe alone prevents most of the bad decisions small clubs make with cohort data.
The counterintuitive part is that small clubs have an advantage bigger orgs don't: you can literally know why every single person left. A 5,000-person org can only guess at churn drivers statistically. You can call all four people who didn't renew. That's worth leaning into.
The minimum sample-size rules I'd actually use
You don't need a stats degree. You need a few hard thresholds that stop you from overreacting. These aren't textbook confidence intervals — they're practical guardrails tuned for the sizes clubs actually deal with.
Keep your membership organized and engaged.
Clubyly simplifies member management, event coordination, and payment collection—effortlessly.
- Unified member database
- Automated payment tracking
- Event scheduling & reminders
No credit card required
| Cohort size | What you can trust | What to do |
|---|---|---|
| Under 15 | Almost nothing rate-wise | Count individuals, list reasons, no rate claims |
| 15–30 | Direction only, not precision | Combine 2–3 cohorts before calling a trend |
| 30–60 | Rough rates (±10 pts) | One-off decisions OK, big changes need more |
| 60–100 | Reasonably stable rates | Segment carefully, test one change at a time |
| 100+ | Standard cohort analysis works | Normal experiment rules apply |
The single most important rule: never make a decision on a single cohort under 30 people. Roll multiple cohorts together. If your quarterly intake is 20, look at the trailing three quarters as one blended cohort of around 60 before you conclude anything about retention direction.
A related trap is over-segmenting. Someone slices a 40-person cohort by acquisition channel, membership tier, and age group, and suddenly they've got cells of 3 or 4 people that mean nothing. Rule of thumb: don't segment a cohort into groups smaller than 15 unless you're just counting reasons, not rates.
A spreadsheet cohort recipe that fits a real club
Forget fancy retention curves. Here's a layout that works in any spreadsheet and takes about an hour to set up the first time.
Set up three tabs:
-
Members — one row per member
join date, join month (cohort), tier, acquisition source, renewal date, status (active/lapsed), and a "reason left" column you fill in manually.
-
Cohort grid — rows are join months, columns are "months since join" (0, 1, 2, 3…). Each cell shows how many of that cohort were still active at that point.
-
Summary — blended cohorts and the individual-reason log.
The core formula for a cell in the grid is just a count of members from that cohort who were still active N months after joining. Using a COUNTIFS against the Members tab:
=COUNTIFS(Members!$C:$C, $A2, Members!$G:$G, "activeatmonth_"&B$1)
Honestly, the version most small clubs actually get value from is simpler than that: a column for each renewal window (30-day, 90-day, 1-year) with a yes/no, and a percentage at the bottom. That's it. The grid is nice-to-have; the yes/no renewal columns are the workhorse.
The step-by-step to build your first real cohort read:
-
Pull every member who joined in the last 12 months into the Members tab.
-
Tag each with their join month.
-
Mark active or lapsed as of today.
-
For anyone lapsed, fill in a one-line reason — call them if you don't know. You have few enough that you can.
-
Group join months into quarters if any single month is under 15.
-
Calculate retention only at the quarter level.
-
Read the reason log alongside the numbers, always together.
That last step matters more than the math. A 78% retention number tells you almost nothing. "78%, and three of the five who left said the meeting time changed" tells you exactly what to fix.
The process looks like this:
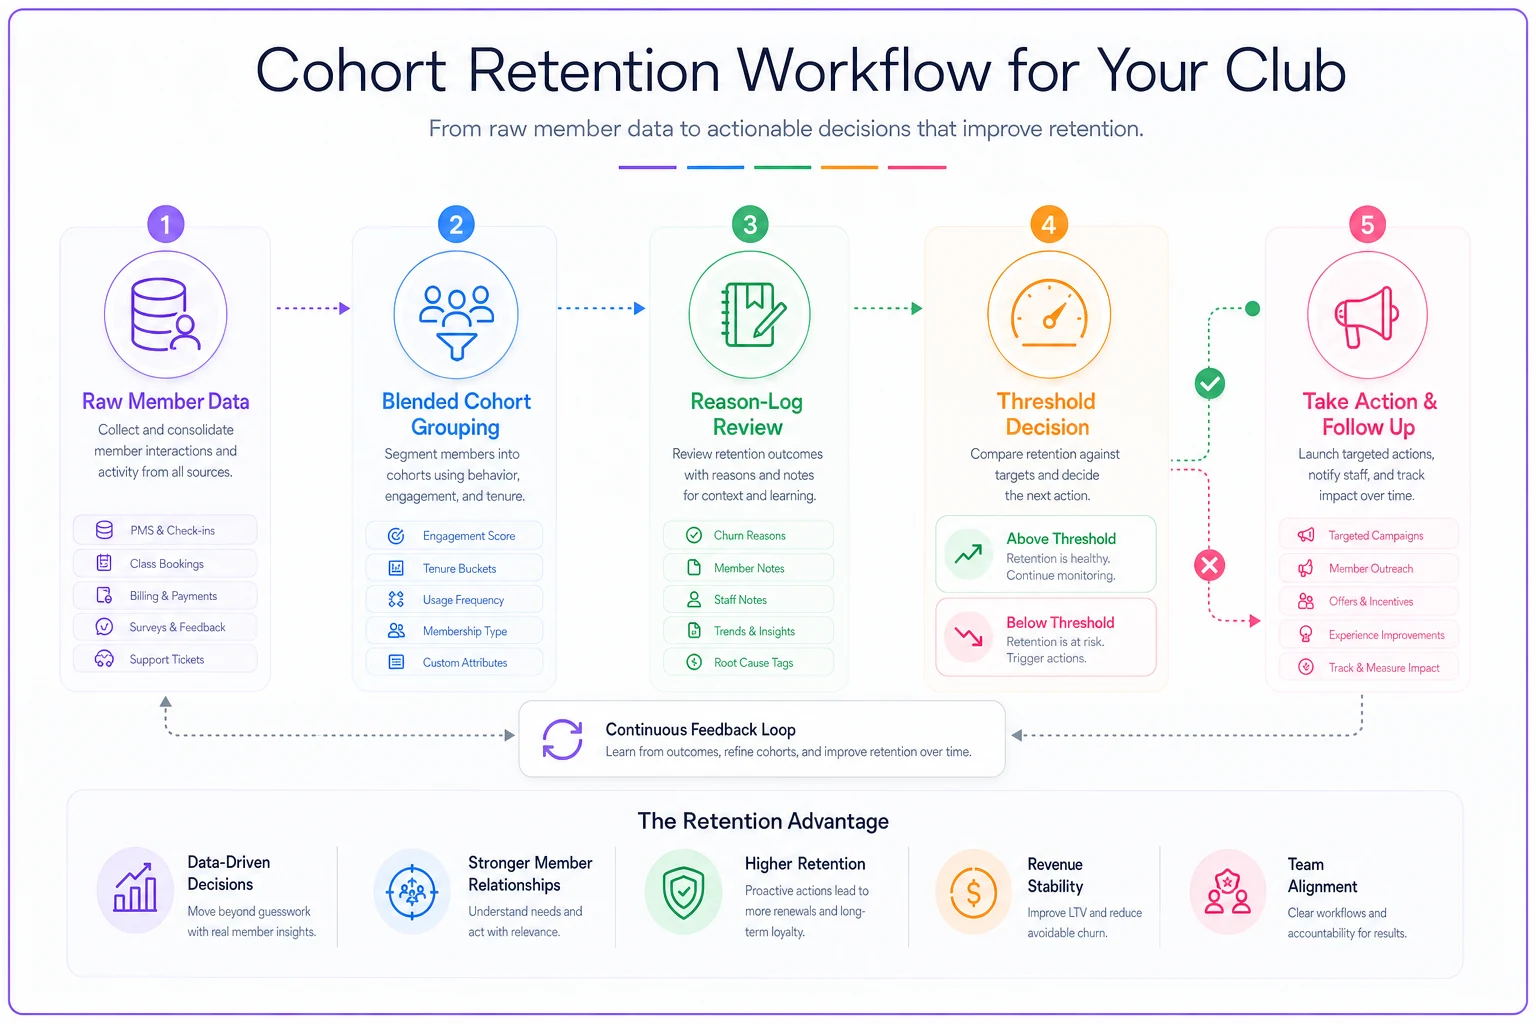
This diagram shows the flow from raw member data through blended cohort grouping to reason-log review and threshold decision.
LTV without pretending you're a hedge fund
Lifetime value for a small club doesn't need discounted cash flow models. You need a number good enough to answer one question: is it worth spending money and volunteer hours to keep a member, and roughly how much?
LTV = average annual dues × average membership length in years
If your dues are $60/year and members stick around about 3.5 years on average, your LTV is roughly $210. Add per-member revenue from events or merch if it's material — say members spend another $40/year at events, that bumps annual value to $100 and LTV to around $350.
The mistake is chasing precision you can't support. With 80 members you cannot calculate "average membership length" reliably for people who are still active — you don't know how long they'll stay. A workable shortcut: use the average tenure of members who've already lapsed as a conservative estimate, knowing it slightly understates true LTV. Understating is fine. It keeps your retention spending disciplined.
Once you have even a rough LTV, retention math gets concrete. If keeping a member is worth around $350 and a welcome-and-check-in sequence costs you a few hours of volunteer time plus maybe $2 in postage, the ROI is obvious. This is the same logic behind auditing what members actually value — the low-cost audit and test process for membership tiers and benefits pairs naturally with LTV, because knowing what a member is worth tells you how much benefit redesign is actually justified.
Decision thresholds: when a number should actually change what you do
The whole point of cohort work is triggering action, not admiring charts. But with small samples you need pre-committed thresholds — decided before you see the data — so you're not rationalizing noise after the fact.
-
90-day retention below 70% across a blended 60-person cohort → activation problem. Look at onboarding, not renewals.
-
First-year retention drops 15+ points versus the prior blended year → real signal worth investigating; anything smaller is likely noise.
-
Same churn reason appears in 3+ exit notes in one quarter → treat as a pattern regardless of percentages. Three people saying "too expensive for what I get" is louder than any rate.
-
A single cohort swings but the reasons are all idiosyncratic (moved, life change) → log it, do nothing.
That third one is the underrated superpower of small clubs. You don't need statistical significance when three humans tell you the same thing in their own words. Qualitative saturation beats quantitative confidence at this scale.
For deciding which retention metric even deserves a threshold, it's worth being ruthless about focus — most clubs track too many things. The breakdown of which engagement metrics actually matter covers how to pick the two or three that actually predict renewal instead of drowning in a dashboard.
Experiment ideas sized for small clubs
You cannot run an A/B test with 40 people and expect a clean result. But you can run before/after cohort comparisons that are directionally useful, especially if the effect is large. Small clubs should only test changes big enough to move the needle noticeably — subtle tweaks are invisible at this sample size.
-
New-member 30-day touch sequence applied to one quarter's cohort, compared to the prior quarter's untouched cohort. You're looking for a 90-day retention swing of 10+ points; anything less is unreadable.
-
Renewal reminder timing — move reminders from 7 days out to 30 days out for one renewal cohort and compare renewal rate. Timing effects are often big enough to see even at n=30.
-
Meeting format change — measure the 90-day retention of members who joined right before versus right after the change.
The key discipline: change one thing, wait a full cohort cycle, and compare blended groups. Running three experiments at once on a 50-person club just contaminates all three.
When cohort analysis is actually a bad idea
If your club has under roughly 40 total members, formal cohort analysis is mostly theater. Keep a spreadsheet of everyone, why they joined, and why any of them left. You'll learn more from ten phone calls than from any retention curve. Cohort math starts earning its keep somewhere north of 60–80 active members with regular intake.
A real scenario
A regional hobbyist club — around 90 members, dues of $55/year, intake of roughly 12–18 people per quarter — was convinced their retention was collapsing. Their Q2 cohort showed 76% first-year retention; Q1 had shown 91%. Panic, emergency meeting, talk of overhauling the whole program.
When they blended the two quarters into one cohort of about 34 and actually listed the leavers, the picture changed. Q2 had 5 lapses out of 21: two moved away, one passed, and two cited a venue change that made meetings hard to reach. That's not a retention crisis — it's one fixable issue hiding inside normal churn noise.
They didn't overhaul anything. They negotiated a better-located venue for one meeting a month and added a simple 30-day check-in for new members. Over the next two blended cohorts, first-year retention settled back into the high 80s, and the venue complaints stopped appearing in exit notes entirely. Total cost: a few volunteer hours and a slightly higher room fee.
The lesson wasn't in the math. It was in refusing to trust a single small cohort and reading the reasons alongside the rate. That combination — blended numbers plus qualitative context — is what actually changes decisions.
Keeping the data clean enough to trust
None of this works if your member data is scattered across a renewal spreadsheet, an email list, and someone's memory. The recurring failure isn't bad analysis — it's that nobody can reliably say who's still active because "active" is defined three different ways in three different places. When join dates are missing or renewal status is stale, even a perfect cohort recipe produces garbage.
The fix is boring but decisive: one source of truth for member status, join date, and renewal date, updated as part of normal operations rather than reconstructed once a quarter for a board meeting. This is where a central member operations system earns its place — not for fancy analytics, but for keeping the underlying record consistent so that when you do pull a cohort, the numbers reflect reality. If exit reasons get logged the moment someone lapses instead of guessed at months later, your entire retention practice gets sharper without any extra statistical sophistication.
Log exit reasons the moment someone lapses to keep your reason log accurate and actionable.
Operational software with basic automation can handle a lot of this passively — flagging lapsed members, prompting staff to log exit reasons, keeping renewal dates current. The point isn't dashboards. It's making sure the raw inputs are trustworthy before anyone runs a single formula.
At club scale, cohort retention is 30% math and 70% listening. Blend your cohorts until they're big enough to mean something, set your action thresholds before you see the data, and always read the reasons next to the rates. The clubs that get this right aren't the ones with the fanciest spreadsheets — they're the ones who resist treating two people leaving as a trend, and who actually pick up the phone and call the members who walked away.
Ready to streamline your club operations?
Join 500+ clubs using Clubyly to save time, boost member engagement, and grow their communities.